Additional information, sources and citations
This landing page is complementary to the video Cows Milk and Climate, authored by Prof Dr Peer Ederer. Its purpose is to provide additional background information to the statements in the video as well as the scientific sources and citations.
Note to the video:
The author Peer Ederer emphasizes that he does not doubt that planet Earth experiences climate change. There can also not be any doubt that there is human-caused climate change, and that such climate change may be in places rapid and have significant economic and ecological consequences.About the Author
Prof Dr Ederer is an entrepreneur and a scientist. As scientist, he teaches, researches and publishes on the links between innovation, new technologies, learning and economic growth, with a particular emphasis on the global food and agribusiness industry.
133 million dairy farmers

Chinese milk ice cream recipe 1400 years old
The article can be retrieved with the search terms “forknchopstix did the Chinese invent ice cream”.

Indian Lassi

World School Milk Day, 30 September 2020
https://www.fil-idf.org/world-school-milk-day-2019/
Note:
Worldschoolmilkday is always on the last Wednesday of September each year.
World Milk Day is one June 1st:
https://worldmilkday.org/
McMaster University
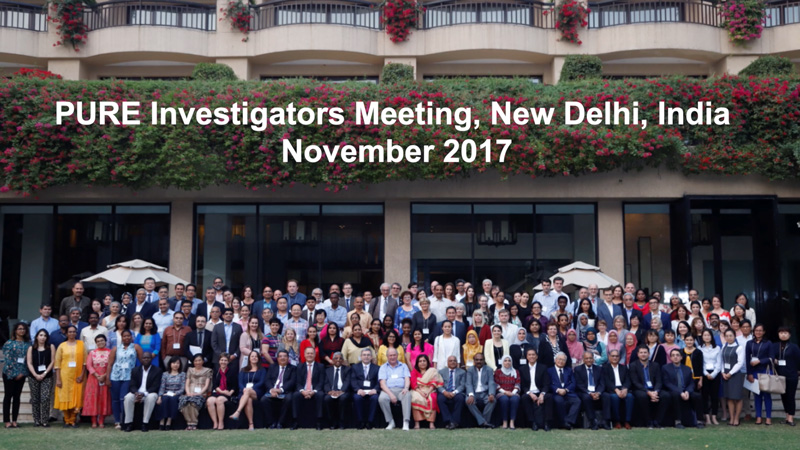
PURE
Note:
Publication by the PURE Research Consortium on effects of dairy intake:
Association of dairy intake with cardiovascular disease and mortality in 21 countries from five continents (PURE): a prospective cohort study
by M Dehghan, A Mente et al, in The Lancet Journal, 2018:
https://www.thelancet.com/journals/lancet/article/PIIS0140-6736(18)31812-9/fulltext
doi.org/10.1016/S0140-6736(18)31812-9

ARD and ZDF Youtube Video
https://www.youtube.com/watch?v=5IpAsztfBBA
Notes:
This video is part of a regular series on a wide range of popular science-oriented topics called: Dinge Erklärt – Kurz Gesagt (English version: Kurzgesagt – in a Nutshell). These videos are typically around 10 minutes in length, are aimed at a target group of 14 to 29-year olds, and are distributed via social media channels such as Youtube, Instagram and similar. The format is widely popular. The videos regularly achieve more than a million views.
Kurzgesagt Videos are produced by a Munich-based Youtube video production company, which was founded in 2013 by Mr Philipp Dettmer, and now has around 30 team members. The videos are created on average with 1200 hours of production time. Authors are not provided. Typically a new video comes out every two weeks, and so far a total of 105 videos have been produced on a wide range of topics from the sciences. According to Mr Dettmer, all videos are vigorously fact-checked and a scientific source is provided for each statement.
Despite Mr Dettmers claim, this is not true for the video on milk. His statements about CO2 production of the dairy industry are erroneous in several ways:
- The video shows as a source FAO 2012. However, there is no relevant FAO publication from 2012
- The number which is quoted in the sources page, 14.5%, instead comes from the FAO Report from 2013 called, “Tackling climate change through livestock: A global assessment of emissions and mitigation opportunities”.
- The main author of this FAO report, Mr H Steinfeld has repeatedly and publicly commented that the Life Cycle Analysis methodology which led to the 14.5% number has a different methodology from IPCC numbers, and can therefore not be compared to IPCC calculations. The equivalence calculation in the video between the global dairy industry and the global airline industry is therefore not permissable.
- The video says that the CO2 emissions of the dairy industry would be 3% of the global greenhouse gas emission budget and amounting to 1.4 billion tons per year. This is wrong. If anything, then this should be called CO2 equivalent emissions.
- Mr Dettmer and his research team do not show in their sources the multiple counter arguments against the FAO 14.5% number, for instance by Prof Dr Frank Mitloehner from University of California Davis, or indeed the statements by FAO itself in how its research is publicly misrepresented. FAO has stated multiple times that it does not recommend a reduction of meat or milk production.
- The video portrays a dairy farm belching with dark fumes from its chimney. That is a highly manipulative illustration bearing no semblance with reality. Dairy farms do not have chimneys of this sort. Methane is both invisible and has no smell. The amounts of methane which are emitted from a dairy barn, are tiny in comparison to the surrounding air. Even if methane would be a pitch-dark gas, its emissions from the farm would not be noticeable to the human eye, because they are so diluted.
The Youtube channel of Kurzgesagt has more than 10 million subscribers, and an accumulated total of more than 800 million views, which makes it Germany’s largest Youtube channel. Only 10% of the users are German.
https://kurzgesagt.org/youtube/
https://www.basicthinking.de/blog/2019/11/05/kurzgesagt-in-a-nutshell-portraet/
Taxes and bans on milk and meat are requested
(German links only):
Zum Beispiel hier:
https://www.fuereinebesserewelt.info/fleisch-verbieten/
https://www.rtl.de/cms/sachsen-anhalt-gruene-streichen-fleisch-von-der-speisekarte-4446544.html
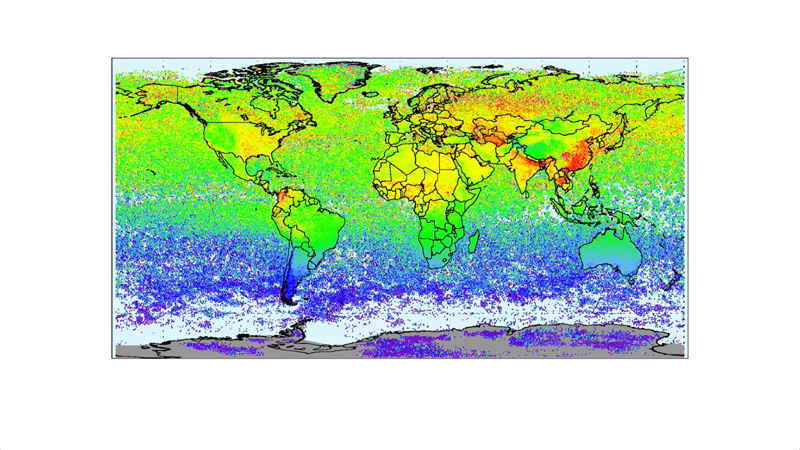
Satellite picture of methane concentrations
http://www.esa-ghg-cci.org/?q=node/116
They are discussed and analyzed in this scientific paper:
Satellite-derived methane hotspot emission estimates using a fast data-driven method
by M Buchwitz et al, in the Atmospheric Chemistry and Physics Journal, 2017
https://www.atmos-chem-phys.net/17/5751/2017/
https://doi.org/10.5194/acp-17-5751-2017
Full citation:
Buchwitz, M., Schneising, O., Reuter, M., Heymann, J., Krautwurst, S., Bovensmann, H., Burrows, J. P., Boesch, H., Parker, R. J., Somkuti, P., Detmers, R. G., Hasekamp, O. P., Aben, I., Butz, A., Frankenberg, C., and Turner, A. J.: Satellite-derived methane hotspot emission estimates using a fast data-driven method, Atmos. Chem. Phys., 17, 5751–5774,
Notes:
The successor mission to Envisat for measuring methane in the atmosphere is called Tropomi and is active since December 2018:
http://www.tropomi.eu/
https://www.scientificamerican.com/article/meet-the-satellites-that-can-pinpoint-methane-and-carbon-dioxide-leaks/
A private company also provides satellite measurements of methane emissions:
https://www.ghgsat.com/who-we-are/company/
Alexander J. Turner at University of California Berkeley researches on methane sources and sinks in the atmosphere:
https://alexjturner.github.io/research.html
Here a recent publication by Mr Turner on methane in the atmosphere:
https://www.pnas.org/content/116/8/2805
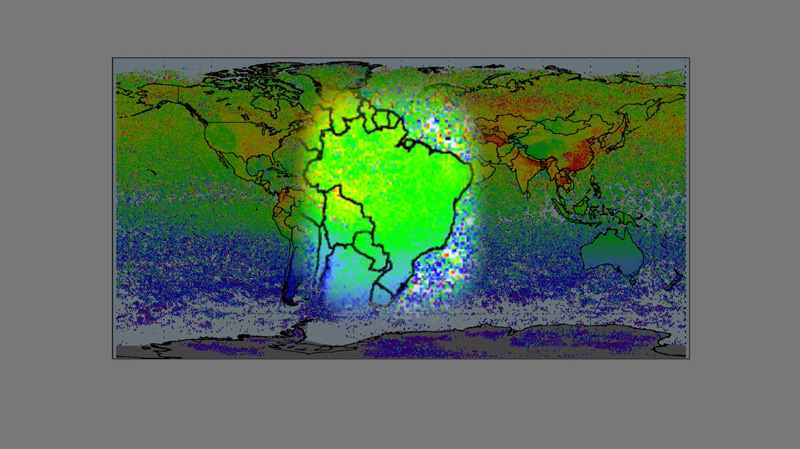
212 million cattle head in Brazil
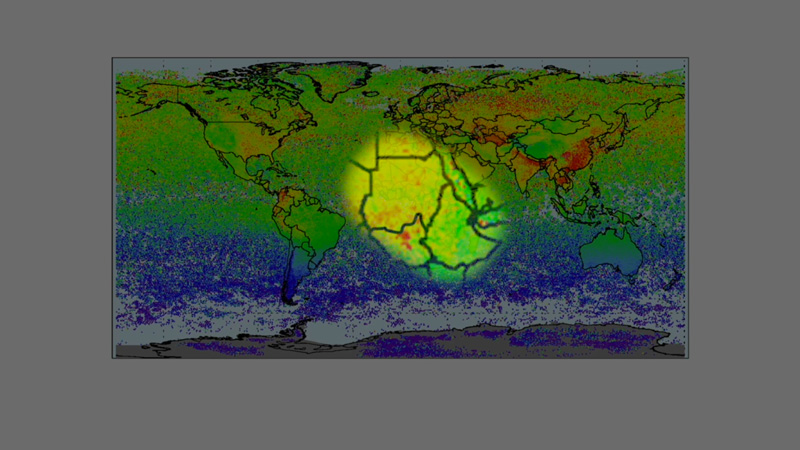
Methane concentrations in Ethiopia and Sudan
Note:
The red spots of high methane concentrations in Sudan and the newly formed country Southern Sudan can be attributed to low-efficiency oil and gas production in this country and are thus not indicative of cattle herds.
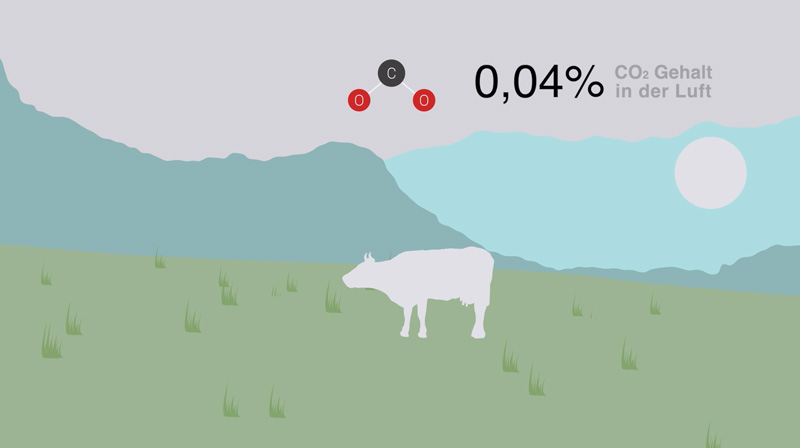
CO2 has 0.04% share in the atmosphere:
https://climate.nasa.gov/news/2915/the-atmosphere-getting-a-handle-on-carbon-dioxide/
Notes:
Without the CO2 and other greenhouse gases in the atmosphere, the Earth’s surface is estimated to be 33 degrees C cooler:
https://www.giss.nasa.gov/research/briefs/ma_01/
A standard explanation on the misnomer of greenhouse gas effect is provided by Wikipedia:
https://en.wikipedia.org/wiki/Greenhouse_effect
A good explanation of Earth’s energy balance is provided by Wikipedia:
https://en.wikipedia.org/wiki/Earth%27s_energy_budget
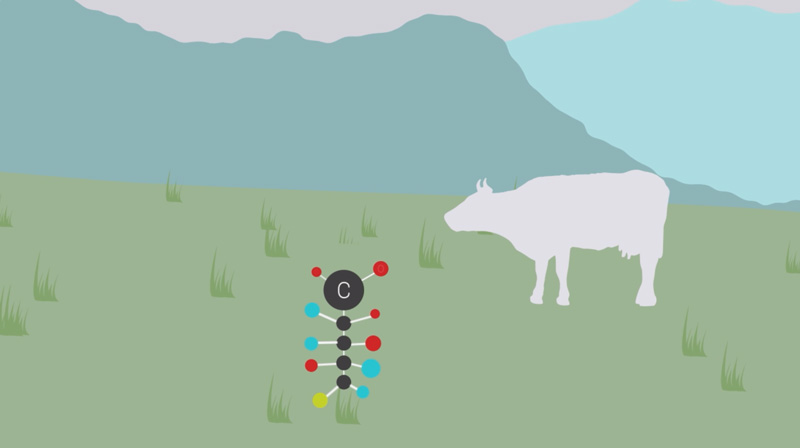
Photosynthesis
Note:
A standard explanation of photosynthesis is provided by Wikipedia:
https://en.wikipedia.org/wiki/Photosynthesis

Burning carbon in body cells
Note:
A standard explanation of how the body cells “burn” carbons in their mitochondria: https://en.wikipedia.org/wiki/Mitochondrion
Cellulose
Note:
A standard explanation of cellulose is provided by Wikipedia:
https://en.wikipedia.org/wiki/Cellulose
Only 14% of all animal feed are useable for human food
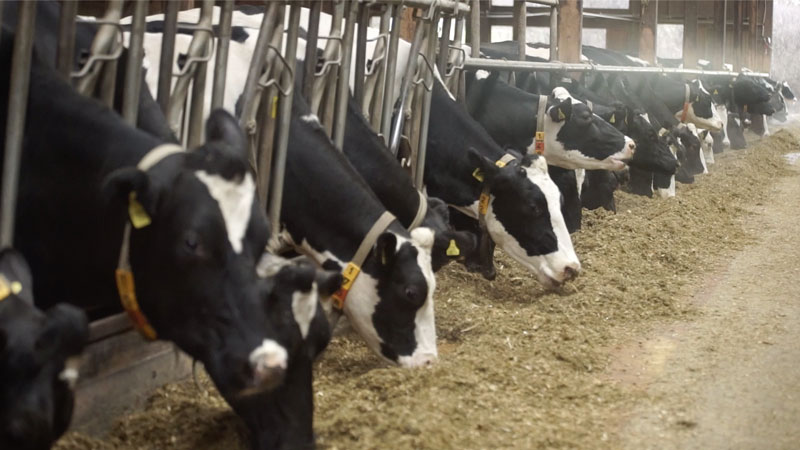
Cows turn 20,000 kilograms of feed into 10,000 kilograms of milk
These are rough and typical performance numbers for a German or Dutch dairy farm cow.

Function of the rumen
Note:
A standard explanation on the biochemical processes in the rumen is provided by Wikipedia:
https://en.wikipedia.org/wiki/Rumen
And a highly illustrative video on the rumen in cows (in German language)
https://www.br.de/mediathek/video/wie-funktioniert-der-pansen-kuh-mit-guckloch-im-bauch-av:5a7ddd36f8937400183e24e8
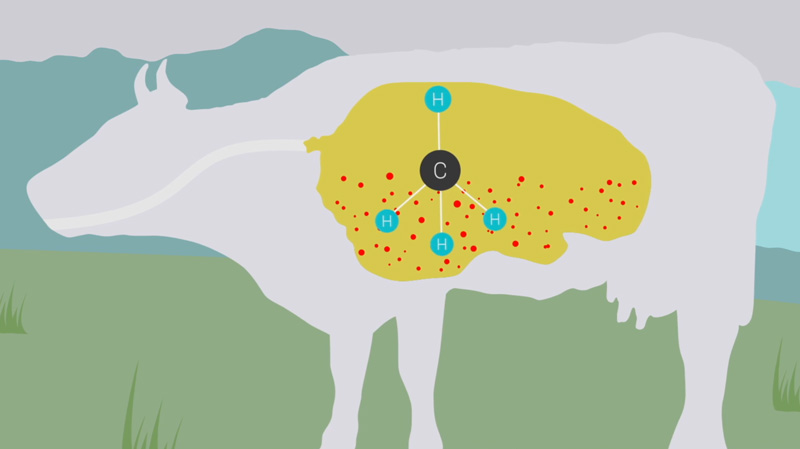
Amount of methane production by a dairy cow is around 120 kilogram per year
Source: Prediction of enteric methane production, yield, and intensity in dairy cattle using an intercontinental database
by M Niu et al in Global Change Biology, 2018
https://www.ncbi.nlm.nih.gov/pmc/articles/PMC6055644/
doi: 10.1111/gcb.14094
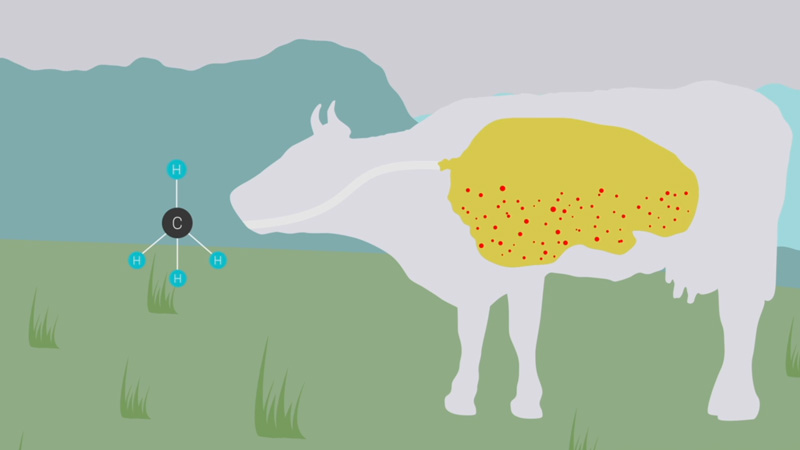
Methane in the atmosphere
Note:
There is considerable confusion concerning the potential greenhouse gas strength of methane. Usually it is written – including in scientific publications – that methane is a 23 to 26 times more potent greenhouse gas than carbon dioxide, and that it remains in the atmosphere for 12 years. However, this is such an extreme oversimplification of the matter that it makes these statements factually wrong.
Methane is not stable in the atmosphere. It reacts with another chemical compound called hydroxyl OH to become CO2 (this description in itself is also a simplification, but shall suffice here). On the other hand, one third of all CO2 emissions remain in the atmosphere forever (ie they stay in the atmosphere for so many millions of years that in human terms it is forever). Therefore the potential impact of a methane gas emission on the climate is completely different from a carbon dioxide emission.
After a short while, because of the reaction with OH, any potential impact of a CH4 methane emission would have disappeared and so the climate would be back to normal under any circumstances. Instead, any potential impact on the atmosphere of a CO2 emission stays on forever. This means that for strict mathematical reasons, only an increase in methane concentration in the atmosphere can lead to additional global warming. Stable levels of methane concentration CANNOT lead to global warming. Therefore, for instance, if the global cattle herd only takes the same place as the previous wild population of ruminants, then the amounts of methane emissions are the same before and after, and therefore there cannot be any global warming effect due to them. For other reasons, the reduction and replacement of the wild megafauna may be a tragedy, but here we are dealing with the climate issues.
However, there is even more confusion and misunderstanding. When the UNFCCC Kyoto Protocol was signed in 1997, its intention was to provide specific targets for greenhouse gas emission reductions. So that the signatories would not have to create separate targets for separate kinds of greenhouse gases, it was agreed to create a unit called “GWP 100 CO2-equivalent”. This unit has been contentious among scientists ever since.
Because the time horizon of potential climate impacts are different for CO2 and CH4, the equivalency calculation compares the global warming potential (GWP) within 100 years. Under such GWP100, one kg of CH4 would have the same GWP as 23 kg of CO2 over 100 years. For this calculation it was assumed that CH4 stays in the atmosphere for 12 years, during which it initially has 120 times the radiative forcing power of CO2, which then quickly decreases as the methane decays. Spread over a 100-year basis, this then becomes a factor of 23 (or 26 or 32 depending on the source). The 100-year horizon was an arbitrary choice for the UNFCCC Kyoto protocol, over a 20-year horizon the CO2 equivalency is much higher (factor 87), and over a 500-year horizon it is much lower (factor 11).
However, even these numbers are starkly simplified. First of all, it is largely unknown how long methane stays in the atmosphere – the chemical reaction process could so far not be observed directly. So the assumption was made, that the total stock of atmospheric methane divided by the sink strength rate indicates the length of time until the methane is removed from the atmosphere. For the year 1998, the two numbers were respectively 4850 Tg of CH4 burden in the atmosphere (corresponding to 1745 parts per billion, ppb), divided by an assumed sink strength rate of 576 Tg per year – which means that the methane would take 8.4 years until it is removed from the atmosphere. But because there would be feedback effects in the upper atmosphere which would delay the reaction with the OH reservoir, this 8.4 number was relatively arbitrarily increased to 12 years of perturbation lifetime.
Secondly, it is also contested among scientists whether methane has any radiative forcing power in addition to water vapor, regardless of how long it stays in the atmosphere. If the infrared wavelength absorption bandwidth of methane is already covered by the much more prevalent water vapor in the atmosphere, then its additional warming potential is much reduced or even zero.
Regardless of what is assumed about the radiative forcing of methane, there are two typical mistakes committed when using the 12-year number of its assumed lifetime. First, it is not that methane stays in the atmosphere for 12 years. Rather, it would take 12 years for all existing methane to be gradually scrubbed away from the atmosphere by the OH reservoir at the assumed rate of removal of the year 1998. So 12 years is not a half-life number, with which such processes are typically described. Second, the 12 years is merely an assumption including additional estimates, the actual calculation amounted to 8.4 years for the year 1998. Third, until the year 2018, the measurements have again changed. The atmospheric burden has in the meanwhile increased to 5140 Tg, while the sink strength is now assumed to be only 548 Tg per year. So the new atmospheric life time number would now be 9.4 years instead of 8.4, and the perturbation lifetime should be correspondingly increased, as well as the GWP 100 value for methane.
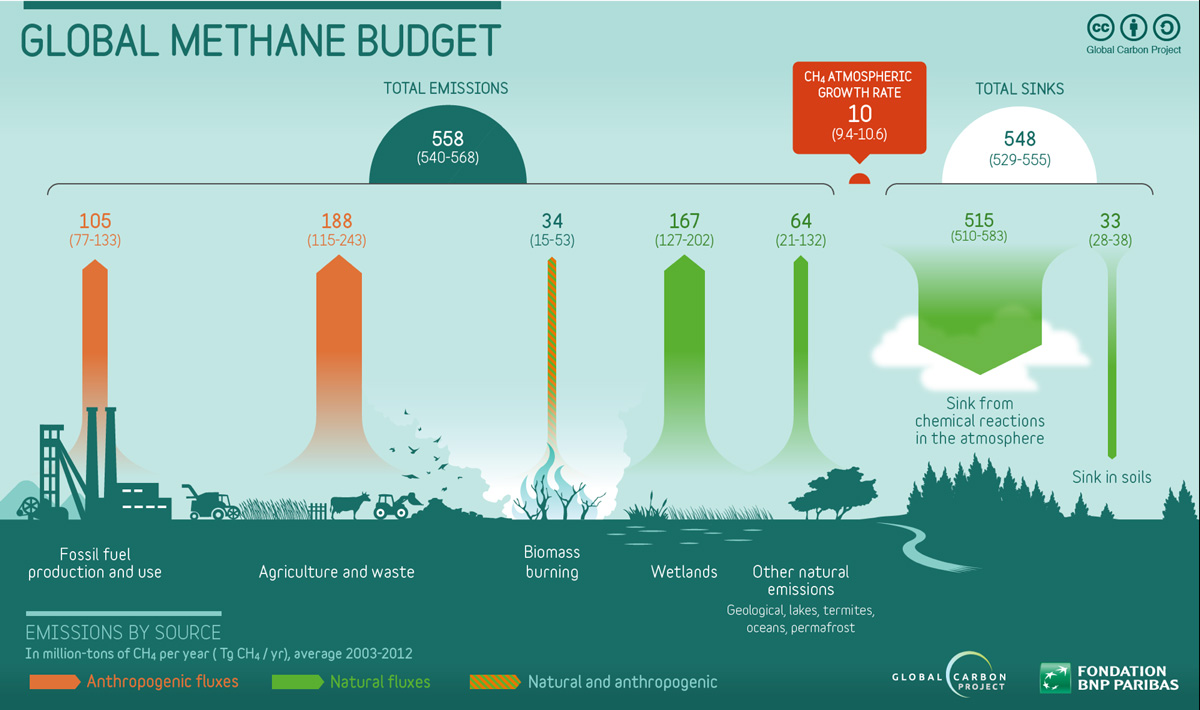
The even more vexed problem with all of the above is, that the sink strength is also only an assumed number. It is basically calculated as the difference between the assumptions on what are the total emissions into the atmosphere, and the actually observed increase of levels. The increase has been 10 Tg per year between 2002 and 2012 (which is relatively certain), so if the emissions were assumed to be 558 Tg (which is highly uncertain), then the sink strength is calculated as 548 Tg (correspondingly highly uncertain).
Here is the quote from the authoritative article on the matter by Kirschke et al 2013, saying the same in scientific language:
«The photochemical sink of CH4 is large and difficult to quantify, given the very short lifetime of OH (~1 sec) and its control by a myriad of precursor species. Direct measurements of atmospheric OH radicals do not have the required accuracy and coverage to derive global OH concentrations and consequently the magnitude of the CH4 sink. We estimated CH4 loss due to OH from the output of nine numerical CCMs, which are categorized here as an atmospheric bottom-up approach.»
There is also another theory explaining the rising methane values in the atmosphere. It says that the rising values are not related to the rising emissions, but are the result from a changing atmospheric chemical equilibrium, whose influencing parameters are not understood yet. If this theory was right, then the reduction of methane emissions would by logic have no impact on the methane concentrations in the atmosphere.
The reality of the matter is, that only little is understood about the sink strength and the radiative forcing power of methane. It is only vaguely understood what all the sinks are, how large they are, how the atmospheric sinks work, how they replenish and how they all interact with each other. It therefore cannot be known with any degree of confidence which methane from which sources stays in the atmosphere, and for how long, and how much net radiative forcing methane truly has under real atmospheric conditions instead of in the laboratory or inside mathematical models.
None of these wide-ranging uncertainties are reflected in the standard recounting of the assumed climate impact of methane.
Here is the publication by Kirschke et al 2013:
https://www.globalcarbonproject.org/global/pdf/pep/Kirschke2013_3DecadesMethane.pdf
DOI: 10.1038/NGEO1955
Here is more scientific description of the above:
https://www.eci.ox.ac.uk/research/energy/downloads/methaneuk/chapter02.pdf
More discussion on atmospheric chemistry details:
http://co2coalition.org/wp-content/uploads/2019/11/Methane-and-Climate_Happer_vanWijngaarden11-25-19.pdf
A view that methane is not an effective greenhouse gas by a MIT Professor:
https://wattsupwiththat.com/2014/04/11/methane-the-irrelevant-greenhouse-gas/
A contrary view that radiative forcing of methane is even higher than assumed by the IPCC:
https://agupubs.onlinelibrary.wiley.com/doi/full/10.1002/2016GL071930
Further discussion on the role of OH, the atmospheric detergent:
https://courses.seas.harvard.edu/climate/eli/Courses/EPS281r/Sources/OH-reactivity/www.atmosphere.mpg.de-oxidation-and-OH-radicals.pdf
More discussion on alternative metrics to GWP 100 and radiative forcing factors – two articles:
https://pubs.rsc.org/en/content/articlelanding/2018/em/c8em00414e#!divAbstract
https://link.springer.com/article/10.1007/s10021-015-9879-4
IPCC reports on radiative forcing from 2018:
https://www.ipcc.ch/site/assets/uploads/2018/02/WG1AR5_Chapter08_FINAL.pdf
The same IPCC report as first draft with more information on radiative forcing:
https://archive.ipcc.ch/pdf/assessment-report/ar5/wg1/drafts/WG1AR5_FOD_Ch08_All_Final.pdf
A short poster overview of methane in the atmosphere is provided in this pdf from a poster session at the American Meteorological Society Conference in 2018:
PDF
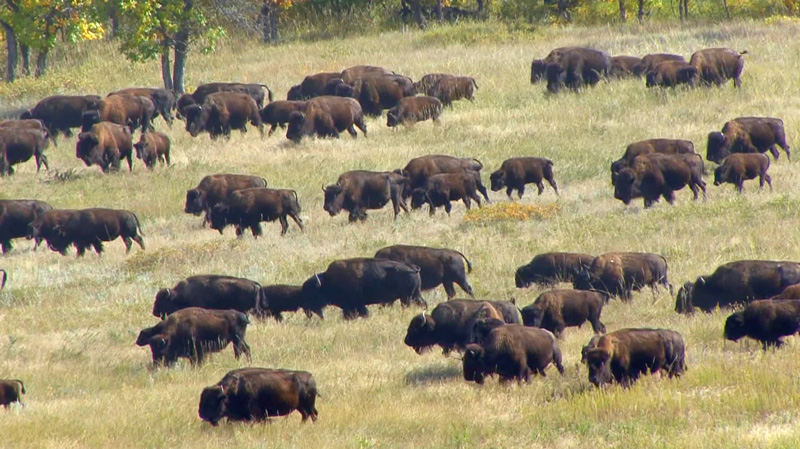
Greenhouse gas emissions in American prairies equal to today
https://www.int-res.com/abstracts/cr/v77/n2/p91-97/
doi.org/10.3354/cr01555
https://www.researchgate.net/publication/330782313_Intensifying_pastoralism_may_not_reduce_greenhouse_gas_emissions_Wildlife-dominated_landscape_scenarios_as_a_baseline_in_life-cycle_analysis
How Responsible are Modern Cows for Greenhouse Gases?
von Alvaro Garcia in Journal of Agriculture and Environmental Sciences, 2013
https://pdfs.semanticscholar.org/073f/d0daf42919eda1fdfb924db8687c8752acd8.pdf
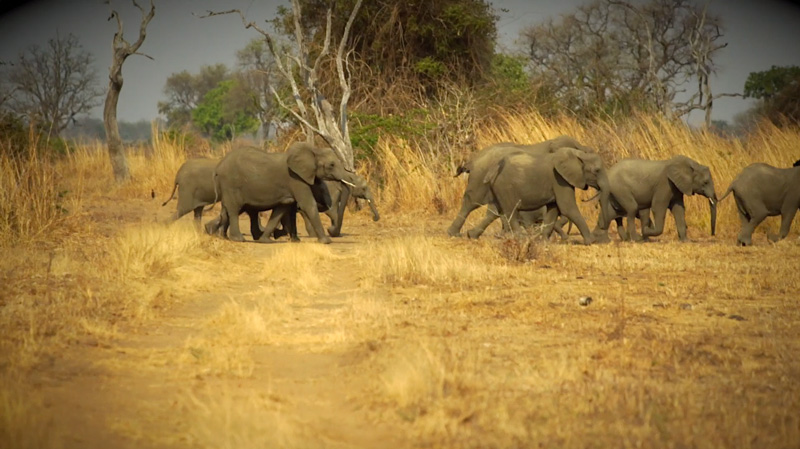
26 million elephants
Source:
http://www.greatelephantcensus.com/background-on-conservation
Note:
Methane emission per elephant is 81 kg per year
Source: South African Journal of Animal Science – Direct greenhouse gas emissions of the game industry in South Africa
by: CJL Du Toit et al in South African Journal of Animal Science, 2013
https://journals.co.za/content/sajas/43/3/EJC146985
https://hdl.handle.net/10520/EJC146985
https://www.researchgate.net/publication/262733372_Direct_greenhouse_gas_emissions_of_the_game_industry_in_South_Africa
There are currently 23 million dairy cows in the EU
Source:
https://ec.europa.eu/eurostat/databrowser/view/tag00014/default/table?lang=e
Northwesteuropean dairy farm cows of the Holstein breed produce 120 kg methane per year. Cows in southern Germany or southern Europe are typically of smaller breeds and produce accordingly less methane. Therefore the European average is likely to be much less than 120 kg, rather towards 100 kg. A corresponding source could not be identified yet.
African elephant emissions 500 years ago: 26 million x 81 kg = 2106 million kg methane per year
EU dairy cow herd emissions: 23 million x 100 kg = 2300 million kg methane per year
Note:
A scientific investigation on the prehistoric state of megafauna on Earth
https://www.pnas.org/megafauna
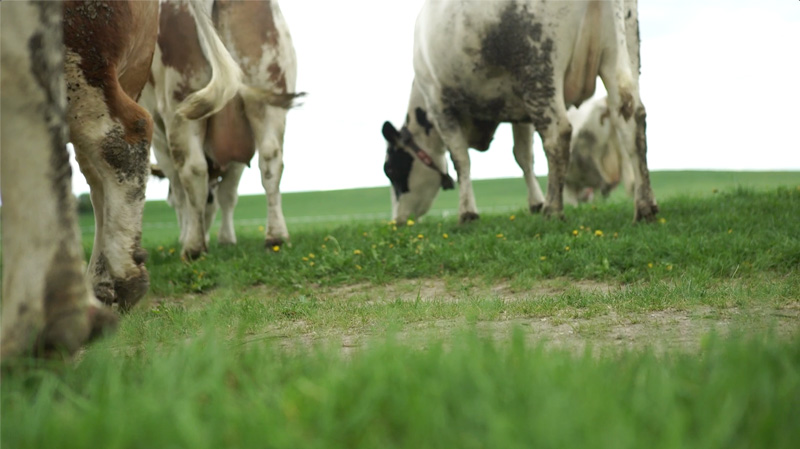
Sequestration of carbons in the soil
Notes:
The sequestration of carbons in soil by agricultural activity is called Regeneration. Regeneration has become a broad field of scientific and practical investigation.
Two scientifically published investigations into soil carbon sequestration potential in USA:
https://asu.pure.elsevier.com/en/publications/potential-mitigation-of-midwest-grass-finished-beef-production-em
https://www.sciencedirect.com/science/article/pii/S0308521X17310338
An internet blogger researched on the potential of regeneration and published his findings in a series of three articles over three years:
https://lachefnet.wordpress.com/2017/05/22/a-measure-of-make-believe/
https://lachefnet.wordpress.com/2018/05/04/ruminations-methane-math-and-context/
https://lachefnet.wordpress.com/2019/08/03/soil-carbon-saturation-myth-or-reality/
A USA Vermont based organization pursues the idea of regeneration around the world:
https://www.soil4climate.org/
There is a famous TED Talk by Allan Savory on the benefits of regeneration. However, Mr Savory does not provide the sources for his claims, so that they cannot be independently verified:
https://www.ted.com/talks/allan_savory_how_to_fight_desertification_and_reverse_climate_change/discussion?language=en
The Food Climate Research Network published an overview on cattle grazing and climate with a wide-ranging coverage of mainstream sources and views. However, this overview is dismissive of regeneration without considering the evidence in detail. This shows that the FCRN may not be as neutral and unbiased as it claims to be:
https://www.fcrn.org.uk/projects/grazed-and-confused
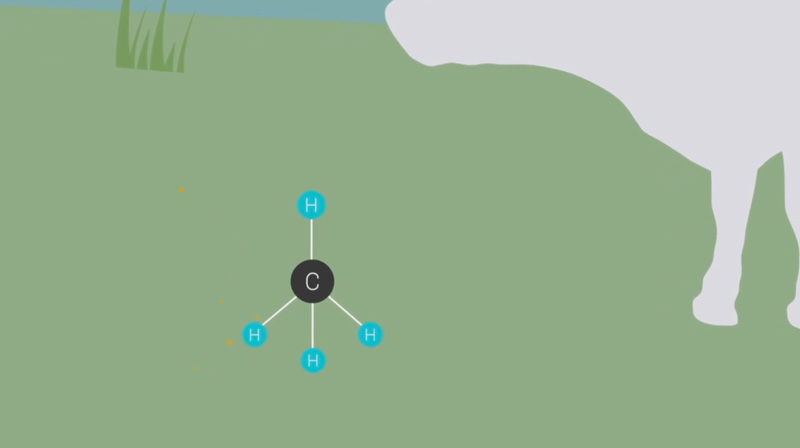
Methane absorption by the soil
https://www.nature.com/articles/srep04444
doi.org/10.1038/srep04444
Source: Key sources and seasonal dynamics of greenhouse gas fluxes from yak grazing systems on the Qinghai-Tibetan Plateau
by Y Liu et al. Scientific reports, 7, 40857, 2017
https://www.nature.com/articles/srep40857
doi.org/10.1038/srep40857
Source: A process-based model of methane consumption by upland soils
by A F Sabrekovet al, in Environmental Research Letters, Volume 11, Number 7, 2016
https://iopscience.iop.org/article/10.1088/1748-9326/11/7/075001/meta
Source: Grazing affects methanotroph activity and diversity in an alpine meadow soil
by G Abell et al in Environmental Microbiology Reports, 2009
https://sfamjournals.onlinelibrary.wiley.com/doi/abs/10.1111/j.1758-2229.2009.00078.x
doi:10.1111/j.1758-2229.2009.00078

Global Carbon Project
Note:
The Global Carbon Project (GCP) is a global research project of Future Earth and a research partner of the World Climate Research Programme. It was formed to work with the international science community to establish a common and mutually agreed knowledge base to support policy debate and action to slow down and ultimately stop the increase of greenhouse gases in the atmosphere.
https://www.globalcarbonproject.org/
In 2016, the GCP published the so far most widely recognized and authoritative balance sheet of the global methane cycle. Its key summary chart is shown below. It shows that the net addition of methane into the atmosphere was 10 Teragrams per year (1Tg = million ton) from 2000 to 2012. This 10 Tg is the net of estimated total emissions of 558 Tg and a total sink of 548 Tg. This means the assumed total emissions are 55 times higher than net increase per year.
Out of the total emissions, agriculture and waste together is assumed to amount to 188 Tg, with a top-down estimation range of 115 to 243 Tg. This means that the uncertainty range of the different mathematical models alone is 12 times larger than the net amount of increase per year.
There is little real understanding of how the atmosphere converts methane into carbon dioxide. It is clear that methane levels in the atmosphere keep rising each year, and that today these levels are three times higher than at any time since the Ice Ages until the Industrial Revolution. It is assumed that only about 40% of today’s methane emissions are natural, but the rate of methane emissions before the Industrial Revolution cannot be reconstructed. If indeed today’s emission rate is factor 2.5x higher than the natural pre-Industrial Revolution background rate, then the sink capacity of the atmosphere to convert methane into carbon dioxide has also increased by nearly the factor 2.5x, or otherwise the methane levels would be rising much faster. It is not clear why or how the sink capacity has been increasing, and why it is not increasing sufficiently to compensate for the comparatively small gap of 10 Tg per year.
In the news release on 12th December 2016 when the global methane budget was published, Prof Robert Jackson, who is the head of the GCP explained:
«Unlike carbon dioxide, where we have well described power plants, almost everything in the global methane budget is diffuse. From cows to wetlands to rice paddies, the methane cycle is harder.»
The corresponding paper is here:
https://www.earth-syst-sci-data.net/8/697/2016/
doi.org/10.5194/essd-8-697-2016
Full citation:
Saunois, M., Bousquet, P., Poulter, B., Peregon, A., Ciais, P., Canadell, J. G., Dlugokencky, E. J., Etiope, G., Bastviken, D., Houweling, S., Janssens-Maenhout, G., Tubiello, F. N., Castaldi, S., Jackson, R. B., Alexe, M., Arora, V. K., Beerling, D. J., Bergamaschi, P., Blake, D. R., Brailsford, G., Brovkin, V., Bruhwiler, L., Crevoisier, C., Crill, P., Covey, K., Curry, C., Frankenberg, C., Gedney, N., Höglund-Isaksson, L., Ishizawa, M., Ito, A., Joos, F., Kim, H.-S., Kleinen, T., Krummel, P., Lamarque, J.-F., Langenfelds, R., Locatelli, R., Machida, T., Maksyutov, S., McDonald, K. C., Marshall, J., Melton, J. R., Morino, I., Naik, V., O'Doherty, S., Parmentier, F.-J. W., Patra, P. K., Peng, C., Peng, S., Peters, G. P., Pison, I., Prigent, C., Prinn, R., Ramonet, M., Riley, W. J., Saito, M., Santini, M., Schroeder, R., Simpson, I. J., Spahni, R., Steele, P., Takizawa, A., Thornton, B. F., Tian, H., Tohjima, Y., Viovy, N., Voulgarakis, A., van Weele, M., van der Werf, G. R., Weiss, R., Wiedinmyer, C., Wilton, D. J., Wiltshire, A., Worthy, D., Wunch, D., Xu, X., Yoshida, Y., Zhang, B., Zhang, Z., and Zhu, Q.: The global methane budget 2000–2012, Earth Syst. Sci. Data, 8, 697–751, https://doi.org/10.5194/essd-8-697-2016, 2016.
A recent 2019 investigation into the generation and distribution of enteric methane emissions in the atmosphere, based on modelling of different C3 or C4 dominated feed components:
https://www.nature.com/articles/s41467-019-11066-3

The IPCC report on 9th August 2019
Source:
https://www.ipcc.ch/srccl/
The quote from page 489 is in Chapter 5, Section 5.5.2.3 called
Uncertainties in demand-side mitigation potential

